
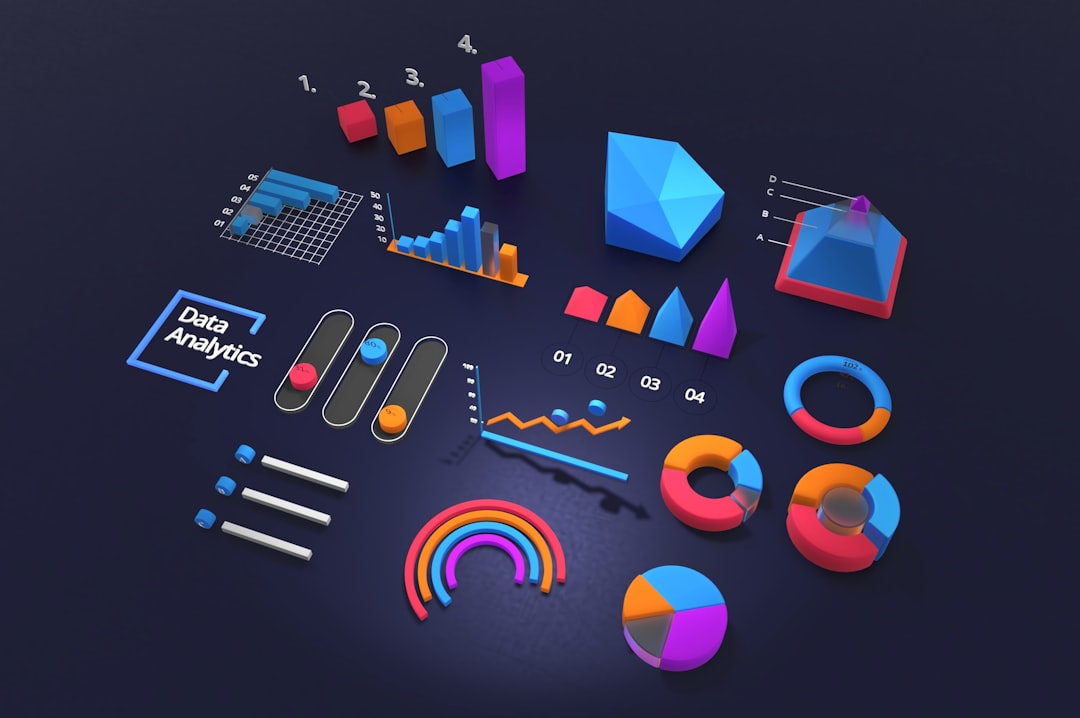
AI graphs are reshaping data visualization by automating chart creation, making information instantly accessible and actionable. In 2026, AI agents empower professionals to turn complex data into clear, interactive visuals—without manual effort. This article shows how to leverage AI to automate charts and unlock the next level of data-driven decision-making.
Why Automate Graph Creation with AI Agents?
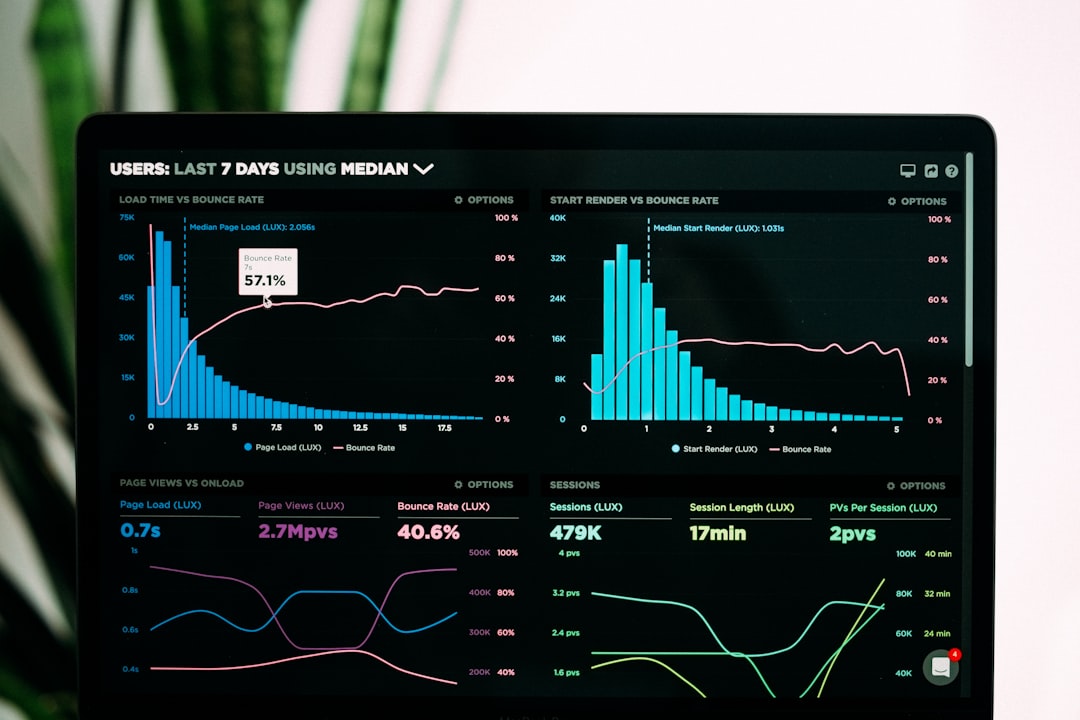
Automating graph creation with AI agents means turning raw data into meaningful visuals in seconds. AI data visualization eliminates repetitive manual tasks and reduces human error, enabling teams to focus on insights. These advancements support real-time analytics, increased accuracy, and effortless reporting for all industries.
- Time Saved Per Report
- 80 %
- Error Reduction
- 90 %
- Faster Insights
- 5x
- Adoption in Enterprises
- 67 %
How Do AI Agents Automate Chart Creation?
AI agents use advanced algorithms to analyze datasets, identify key patterns, and automatically select the most effective visual representation. They streamline the process from data import to final visualization, integrating with popular tools and platforms. For example, you can connect AI agents to spreadsheets, databases, or even live data feeds for continuous, automated updates.
| Feature | Traditional Workflow | AI-Powered Workflow |
|---|---|---|
| Chart Selection | Manual, time-consuming | Automated, context-aware |
| Data Cleaning | Requires user intervention | AI-driven, seamless |
| Update Frequency | Periodic, manual | Real-time, automatic |
| Customization | Limited by user skill | AI-suggested, adaptive |
Key Benefits of AI-Driven Data Visualization
- <strong>Speed</strong> — Instantly transform complex data into actionable graphs.
- <strong>Accuracy</strong> — Reduce human error and ensure data integrity.
- <strong>Scalability</strong> — Handle vast datasets and frequent updates effortlessly.
- <strong>Accessibility</strong> — Enable non-technical users to generate insightful charts.
- <strong>Actionable Insights</strong> — AI highlights trends and anomalies automatically.
AI-powered data visualization democratizes analytics, allowing any business user to generate sophisticated charts without technical expertise.
— Jessica Lee, Data Science Lead at VisualIQ
Best Practices for Implementing AI Graph Automation
To maximize the value of automated chart creation, organizations should follow proven strategies. Start with high-quality, well-structured data and choose AI tools compatible with your existing tech stack. Regularly review AI-generated visuals for relevance and accuracy, and train teams on interpreting AI-suggested insights for better decision-making.
- First AI Charting Tools — Initial releases of automated chart plugins for spreadsheets and BI platforms.
- Enterprise AI Integration — AI agents become standard in enterprise data visualization suites.
- Real-Time AI Charting — Widespread adoption of live, AI-generated dashboards in businesses.
AI Graphs in Action: Industry Use Cases
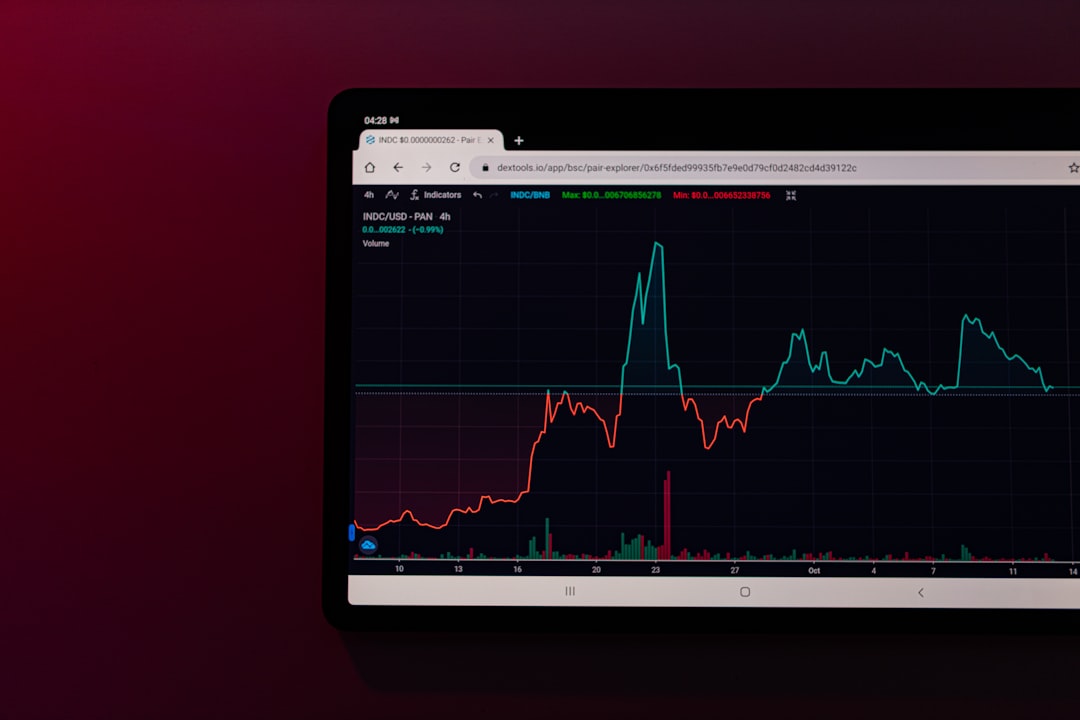
AI graphs are widely used across industries to accelerate insights. In manufacturing, automated charts track KPIs and production anomalies. Finance teams use AI to generate compliance-ready reports. Marketing departments automate campaign performance dashboards, while supply chain managers visualize logistics in real time. These use cases demonstrate the universal impact of AI-powered data visualization.
Choosing the Right AI Data Visualization Tools
When selecting tools for AI data visualization, consider criteria such as integration capabilities, supported data sources, chart variety, and ease of use. Solutions like Google Bard, Power BI with Copilot, and emerging AI charting platforms offer robust automation and customization options. For a deep dive into dashboard automation, explore our article From Data to Insights: AI Dashboard Automation or learn how to Unlock Dynamic Dashboards Instantly.
| Tool | Integration | AI Features | Price Range |
|---|---|---|---|
| Google Bard Visualizations | Google Workspace | Auto-chart, insights | $$ |
| Power BI Copilot | Microsoft 365, Azure | AI charting, Q&A | $$-$$$ |
| ChartGenie AI | Standalone/API | Smart charting, anomaly detection | $ |
Future Trends: What’s Next for AI-Driven Charts?
Looking ahead, AI chart automation will become even more intuitive. Expect natural language queries, personalized dashboard recommendations, and deeper integration with predictive analytics. As generative AI continues to evolve, fully autonomous data storytelling—where AI not only creates charts but narrates insights—will define the next era of data visualization.
- AI Graph Automation
- Data Integration
- Chart Generation
- User Interaction
- Spreadsheets
- Databases
- Smart Chart Suggestions
- Anomaly Detection
- Natural Language Queries
- Custom Dashboards
- What is AI graph automation?
- AI graph automation refers to the use of artificial intelligence agents to automatically generate charts and graphs from raw data, minimizing manual input and accelerating insights.
- How do AI agents select the right chart type?
- AI agents analyze data structure and context to recommend the most effective visualization, such as line, bar, or pie charts, ensuring clarity and relevance.
- Can AI-generated charts be customized?
- Yes, most AI data visualization tools allow users to edit, filter, and style AI-generated charts, combining automation with flexibility.
- Which industries benefit most from AI automated charts?
- Industries such as manufacturing, finance, marketing, and logistics benefit greatly from AI chart automation due to their need for real-time, accurate data insights.
- Are AI charting tools secure for sensitive business data?
- Reputable AI visualization platforms use robust security protocols and data encryption to protect sensitive information during processing and visualization.
- What is the future of AI in data visualization?
- AI will offer more conversational interfaces, predictive analytics, and automated data storytelling, making insights even more accessible to all users.